Analyzing AWS Amplify Access logs. Part 1.
- modified:
- reading: 6 minutes
AWS has a lot of great services, that is true. But sometimes integrations between them look more like a result of a hackathon project. One of those is the Access logs of the AWS Amplify websites.
In this set of posts, I will show you, at first how you can quickly analyze the logs locally with some common tools, and later how you can set up a flow of exporting logs to S3, running SQL queries with Athena, and send automated emails with the daily reports.
Download Access logs from AWS Amplify
You can download Access logs with the Web Interface or use AWS CLI.
Download Access logs from AWS Amplify with AWS CLI
I assume you have jq tool installed. If not, you can install it on macOS with
brew install jq. For Windows, I suggest using scoop.
First, list the applications. We need to get an appId
aws amplify list-apps | jq '.apps | .[] | {appId: .appId, name: .name}'
The output will be similar to
{
  "appId": "YYY6dn0mprqXXX",
  "name": "loshadki-web"
}
You can also list domain associations if you don’t remember which domain you are using for your website
aws amplify list-domain-associations --app-id YYY6dn0mprqXXX | \
  jq '.domainAssociations | .[] | .domainName'
The output
"loshadki.app"
"loshadki.cloud"
And the last one, using the correct appId and domain-name we can generate a link to download the logs. We also will
configure start time as 24 hours ago till now
aws amplify generate-access-logs \
  --start-time $(date -v-24H +%s) \
  --end-time $(date +%s) \
  --app-id d366dn0mprqzhg \
  --domain-name loshadki.app
The output will be a JSON, containing a pretty long URL string that tells us where to get these logs
{
    "logUrl": "https://xxx.us-west-2.amazonaws.com/YYY6dn0mprqXXX/loshadki.app/...."
}
We can also use the output directly for curl
curl -o access_logs_$(date -v-24H +%s)_$(date +%s).csv \
  $(\
    aws amplify generate-access-logs \
                --start-time $(date -v-24H +%s) \
                --end-time $(date +%s) \
                --app-id d366dn0mprqzhg \
                --domain-name loshadki.app | \
    jq -r '.logUrl'\
  )
After invoking this command, you should have Access logs in the file access_log_{STARTTIME}_{ENDTIME}.csv.
Analyzing Access logs
Numbers.app or Microsoft Excel
As crazy as it sounds, you can use the Numbers.app or Microsoft Excel for analyzing the CSV, including building Visualization. I have tried to do something in Numbers.app, but I am not a spreadsheet ninja. You can group by, filter the data, and visualize the data. For more information, I would suggest looking at the Numbers User Guide.
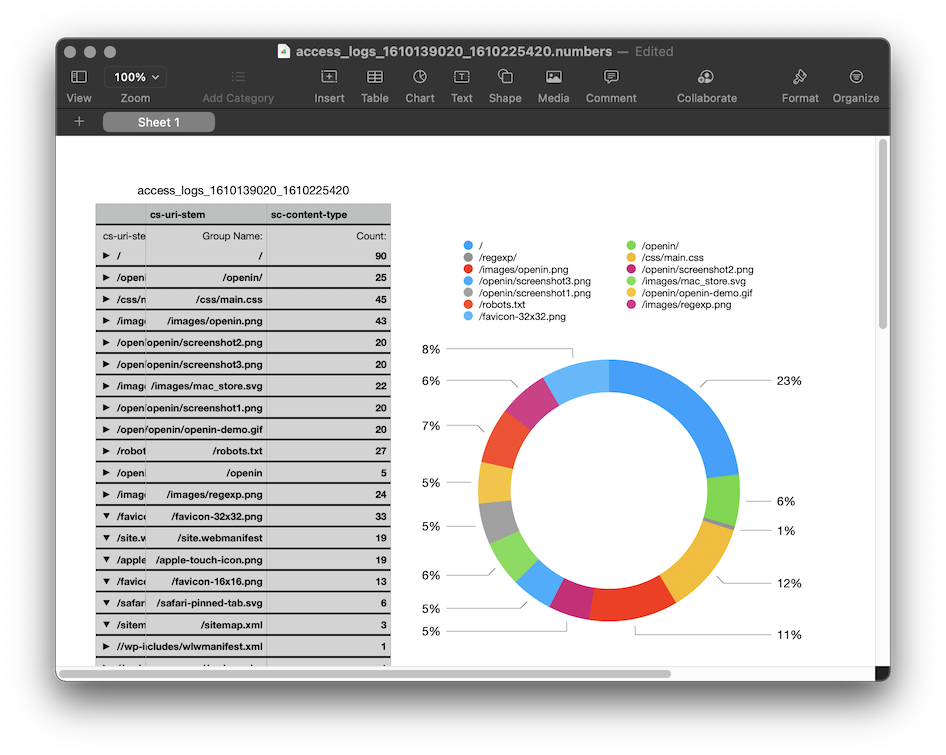
It is fun to do something like that, but we, developers, prefer SQL, right?
sqlite3 shell
Get familiar with Command Line Shell For SQLite
You can use csv mode to import data from csv file and run SQL over it. The file I downloaded has a name
access_logs_1610139020_1610225420.csv. To load this file in SQL use
sqlite3
After that, use SQLite shell to work with the data
SQLite version 3.32.3 2020-06-18 14:16:19
Enter ".help" for usage hints.
Connected to a transient in-memory database.
Use ".open FILENAME" to reopen on a persistent database.
sqlite> .mode csv
sqlite> .import access_logs_1610139020_1610225420.csv access_logs
sqlite> .tables
access_logs
sqlite> .schema access_logs
CREATE TABLE access_logs(
  "date" TEXT,
  "time" TEXT,
  "x-edge-location" TEXT,
  "sc-bytes" TEXT,
  "c-ip" TEXT,
  "cs-method" TEXT,
  "cs\(Host)" TEXT,
  "cs-uri-stem" TEXT,
  "sc-status" TEXT,
  "cs\(Referer)" TEXT,
  "cs\(User-Agent)" TEXT,
  "cs-uri-query" TEXT,
  "cs\(Cookie)" TEXT,
  "x-edge-result-type" TEXT,
  "x-edge-request-id" TEXT,
  "x-host-header" TEXT,
  "cs-protocol" TEXT,
  "cs-bytes" TEXT,
  "time-taken" TEXT,
  "x-forwarded-for" TEXT,
  "ssl-protocol" TEXT,
  "ssl-cipher" TEXT,
  "x-edge-response-result-type" TEXT,
  "cs-protocol-version" TEXT,
  "fle-status" TEXT,
  "fle-encrypted-fields" TEXT,
  "c-port" TEXT,
  "time-to-first-byte" TEXT,
  "x-edge-detailed-result-type" TEXT,
  "sc-content-type" TEXT,
  "sc-content-len" TEXT,
  "sc-range-start" TEXT,
  "sc-range-end" TEXT
);
As an example, we can query the top 10 URL, which results in 4xx status code with the following SQL
select "cs-uri-stem", count(*)
from access_logs
where cast("sc-status" as INT) > 400
group by "cs-uri-stem"
order by 2 desc
limit 10;
The output of this SQL
sqlite> select "cs-uri-stem", count(*)
   ...> from access_logs
   ...> where cast("sc-status" as INT) > 400
   ...> group by "cs-uri-stem"
   ...> order by 2 desc limit 10;
/app-ads.txt/,1
/administrator/,1
/admin/login.php/,1
/admin/admin.php/,1
/admin/,1
/admin.phtml/,1
//xmlrpc.php,1
//wp2/wp-includes/wlwmanifest.xml,1
//wp1/wp-includes/wlwmanifest.xml,1
//wp/wp-includes/wlwmanifest.xml,1
JetBrains DataGrip
If you have a JetBrains subscription and have access to the DataGrip, you can get a slightly better interface for working with the data.
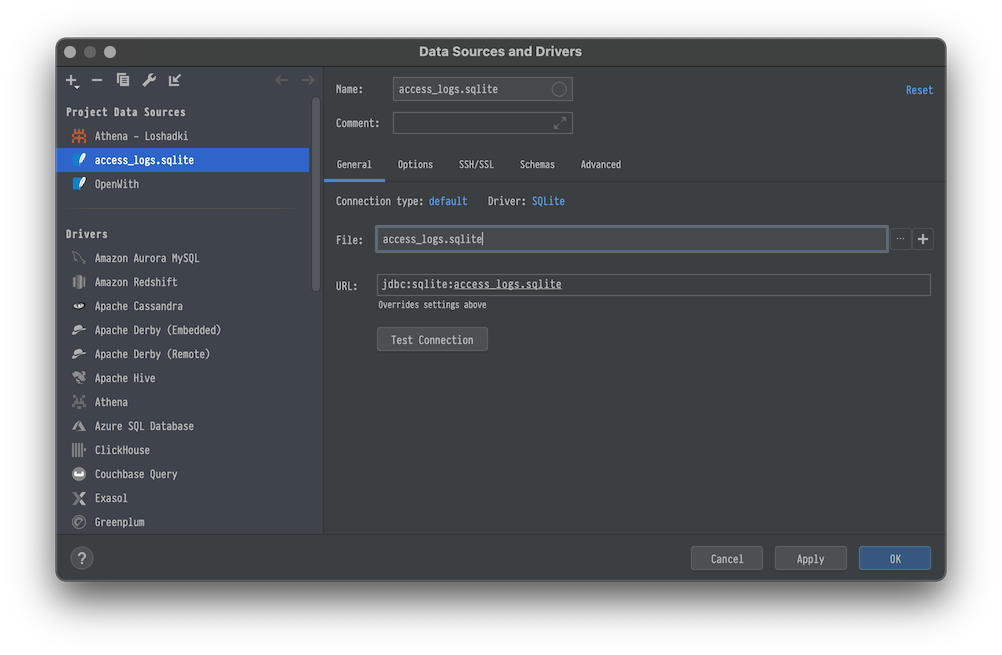
Add new Data Source and specify the name and file, for example access_logs.sqlite
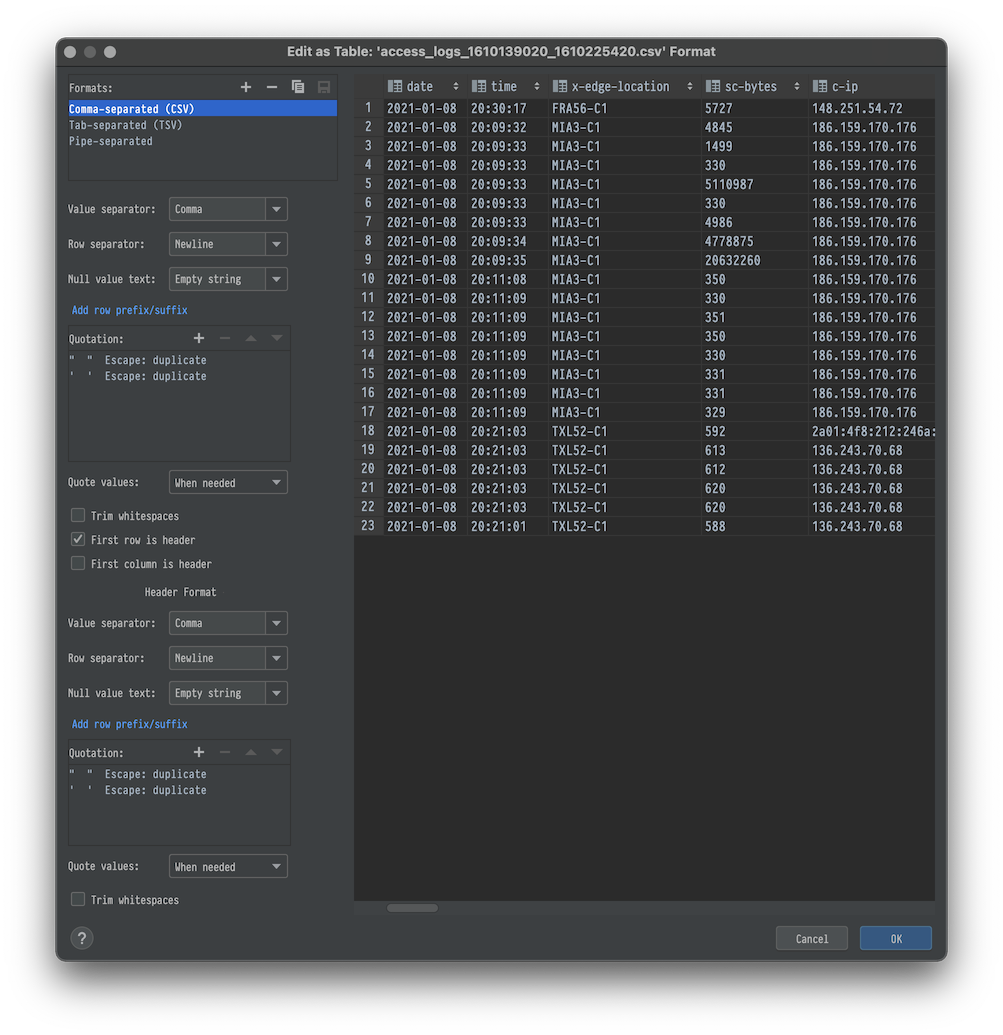
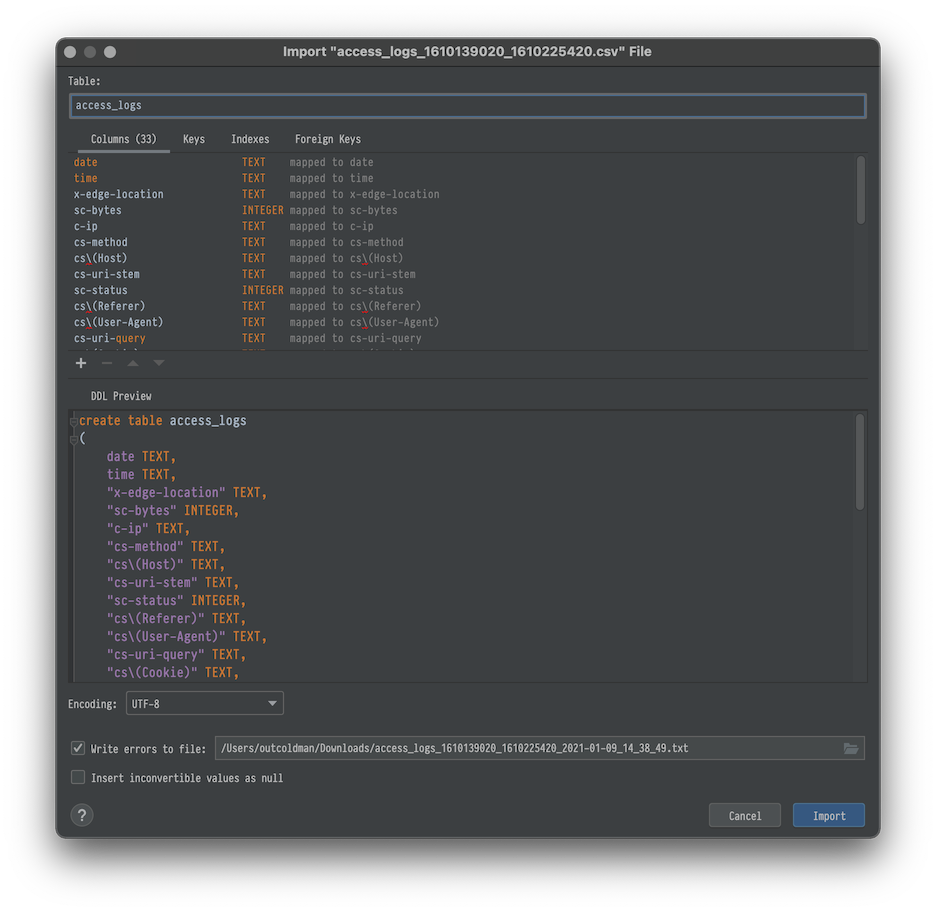
Open CSV file in DataGrip. From the menu Edit → Edit as table. Make sure that the First row is header is selected.
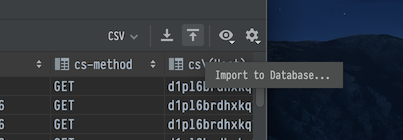
At the top you will see Import to Database
We will select access_logs.sqlite (Just created database). And on the next step we name the table access_logs
and click Import.
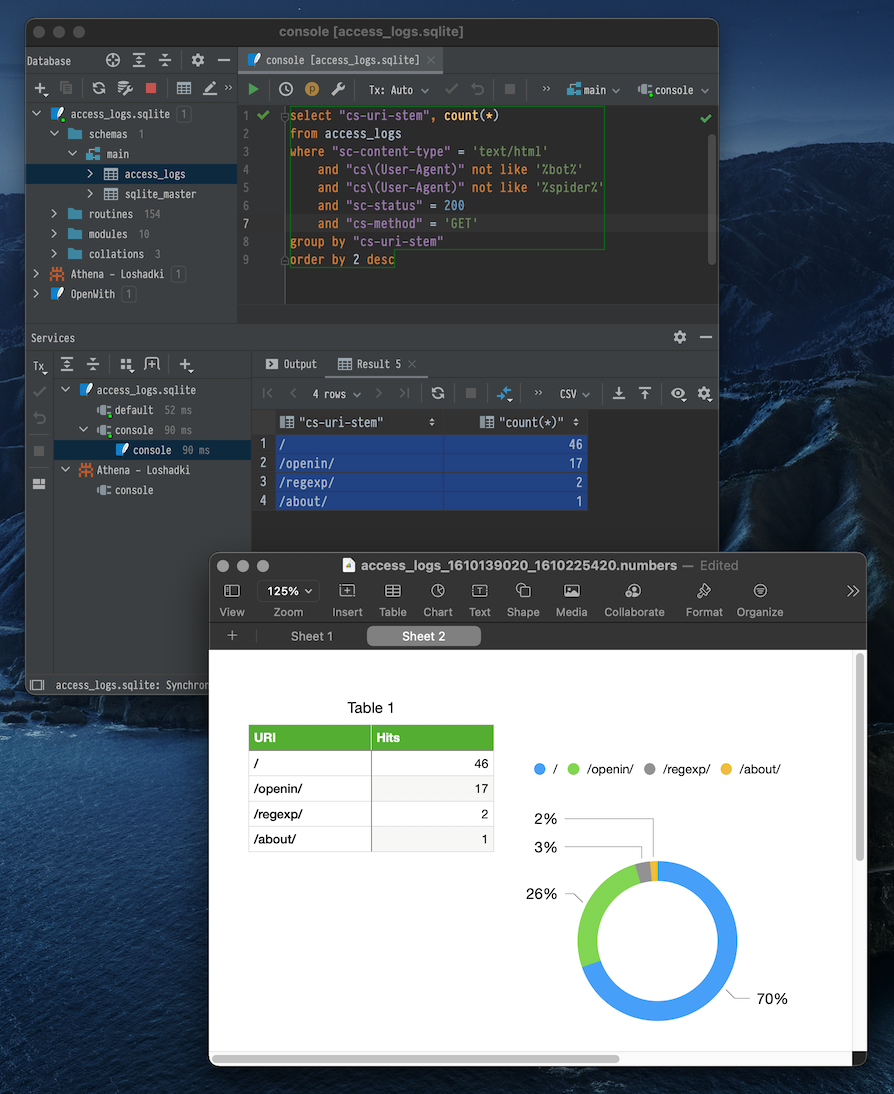
Now we can play with the data with a more pleasant experience (this SQL example shows you top visited URLs, trying to exclude bots and spiders)
select "cs-uri-stem", count(*)
from access_logs
where "sc-content-type" = 'text/html'
    and "cs\(User-Agent)" not like '%bot%'
    and "cs\(User-Agent)" not like '%spider%'
    and "sc-status" = 200
    and "cs-method" = 'GET'
group by "cs-uri-stem"
order by 2 desc
And after doing all the hard work with the SQL, it will be much easier to export data to Numbers to present it with visualizations.
SQLPro for SQLite
If you have SetApp.com subscription for macOS. Or maybe you already have access to SQLPro Studio, you can use it as well.
Create a new SQLite database. Switch to query, and let’s create a new table by running the following query
create table access_logs
(
	date TEXT,
	time TEXT,
	"x-edge-location" TEXT,
	"sc-bytes" INTEGER,
	"c-ip" TEXT,
	"cs-method" TEXT,
	"cs\(Host)" TEXT,
	"cs-uri-stem" TEXT,
	"sc-status" INTEGER,
	"cs\(Referer)" TEXT,
	"cs\(User-Agent)" TEXT,
	"cs-uri-query" TEXT,
	"cs\(Cookie)" TEXT,
	"x-edge-result-type" TEXT,
	"x-edge-request-id" TEXT,
	"x-host-header" TEXT,
	"cs-protocol" TEXT,
	"cs-bytes" INTEGER,
	"time-taken" REAL,
	"x-forwarded-for" TEXT,
	"ssl-protocol" TEXT,
	"ssl-cipher" TEXT,
	"x-edge-response-result-type" TEXT,
	"cs-protocol-version" TEXT,
	"fle-status" TEXT,
	"fle-encrypted-fields" TEXT,
	"c-port" INTEGER,
	"time-to-first-byte" REAL,
	"x-edge-detailed-result-type" TEXT,
	"sc-content-type" TEXT,
	"sc-content-len" TEXT,
	"sc-range-start" TEXT,
	"sc-range-end" TEXT
);
After that, use the Menu Data→Import→CSV and select the original CSV file. It should automatically map all the columns
to the correct columns of the access_logs table.
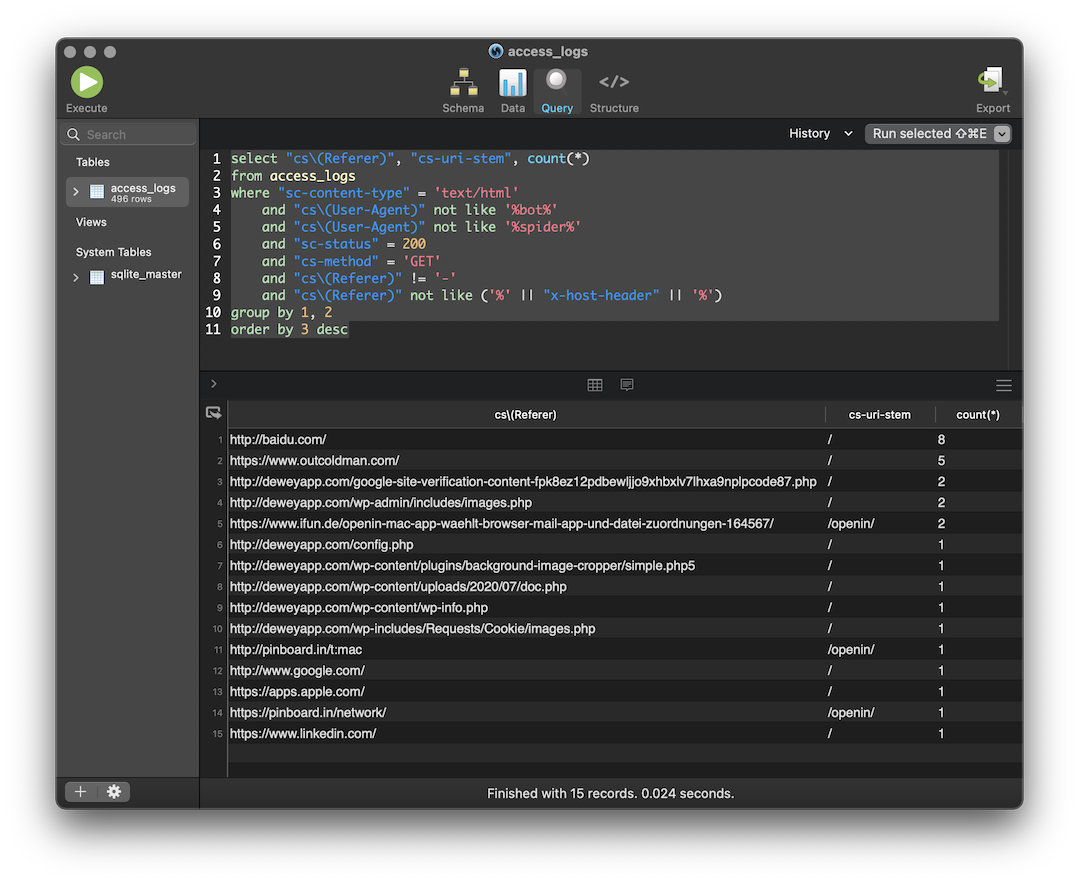
Now we can play to run the following query to show the referers for our site
select "cs\(Referer)", "cs-uri-stem", count(*)
from access_logs
where "sc-content-type" = 'text/html'
    and "cs\(User-Agent)" not like '%bot%'
    and "cs\(User-Agent)" not like '%spider%'
    and "sc-status" = 200
    and "cs-method" = 'GET'
    and "cs\(Referer)" != '-'
    and "cs\(Referer)" not like ('%' || "x-host-header" || '%')
group by 1, 2
order by 3 desc
What is next?
It is a pretty nice way to look at the access logs and analyze them quickly. It works perfectly when you are developing a website or want to run the ad-hoc one-time query. But if you want to monitor your website constantly, you need to have something better. In the next part, we configure a flow for uploading the logs to Athena to have historical access to this data.