Kubernetes: Monitoring Resources
- modified:
- reading: 5 minutes
You know that monitoring is a hot topic this year when you see such variety of ways how you can monitor kubernetes cluster.
If you are using Splunk - we provide solution to monitor and collect logs from Kubernetes. Please take a look on Monitoring Kubernetes.
cAdvisor
It all starts from cAdvisor. Kubelet is built
with cAdvisor. You can find the source code responsible for /stats endpoint
under release-1.7:pkg/kubelet/server/stats.
With kubectl proxy you can get access to this endpoint by
kubectl proxy &
curl localhost:8001/api/v1/nodes/$(kubectl get nodes -o=jsonpath="{.items[0].metadata.name}")/proxy/stats/
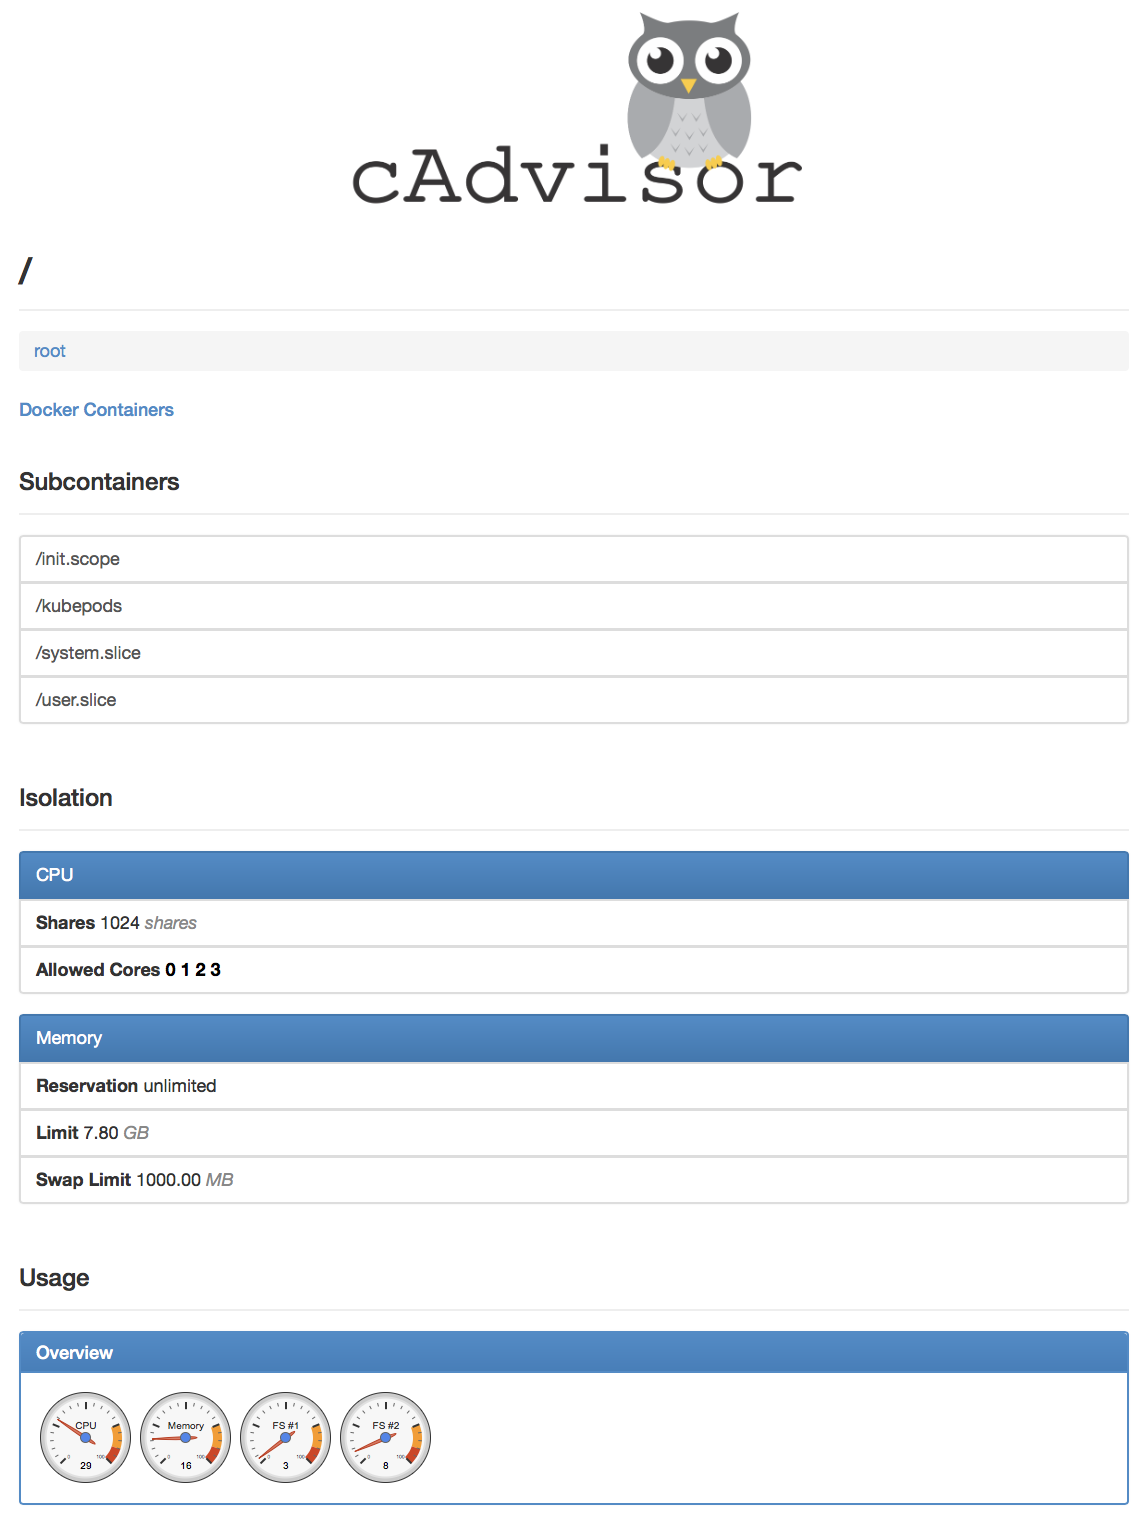
Web Interface and API of cAdvisor can be enabled with --cadvisor-port
argument (see kubelet).
For example if you are using minikube you can start it with
minikube start --extra-config=kubelet.CAdvisorPort=4194
To get access to the cAdvisor Web UI just use
open http://$(minikube ip):4194
If you are using kubeadm, you need to modify
sudo vim /etc/systemd/system/kubelet.service.d/10-kubeadm.conf
sudo systemctl daemon-reload
sudo systemctl restart kubelet.service
And set the --cadvisor-port=4194. See Managing the kubeadm drop-in file for the kubelet
for more details.
Kubelet
Kuberlet’s /metrics endpoint has a lot of information, including metrics for etcd,
go metrics, provided by prometheus.
And yes, the format of the returned data is defined by prometheus. It should include cadvisor metrics as well (see below)
kubectl proxy &
curl localhost:8001/metrics
You should be able to see all cAdvisor specific metrics, including container resources.
But In kubernetes 1.7 this behavior was broken. See After upgrading to 1.7.0, Kubelet no longer reports cAdvisor stats.
Heapster
Heapster is built as independent process. It can pull metrics from kubernetes cluster, store them in memory (limited amount) and forward to one or more of the sinks, including logs.
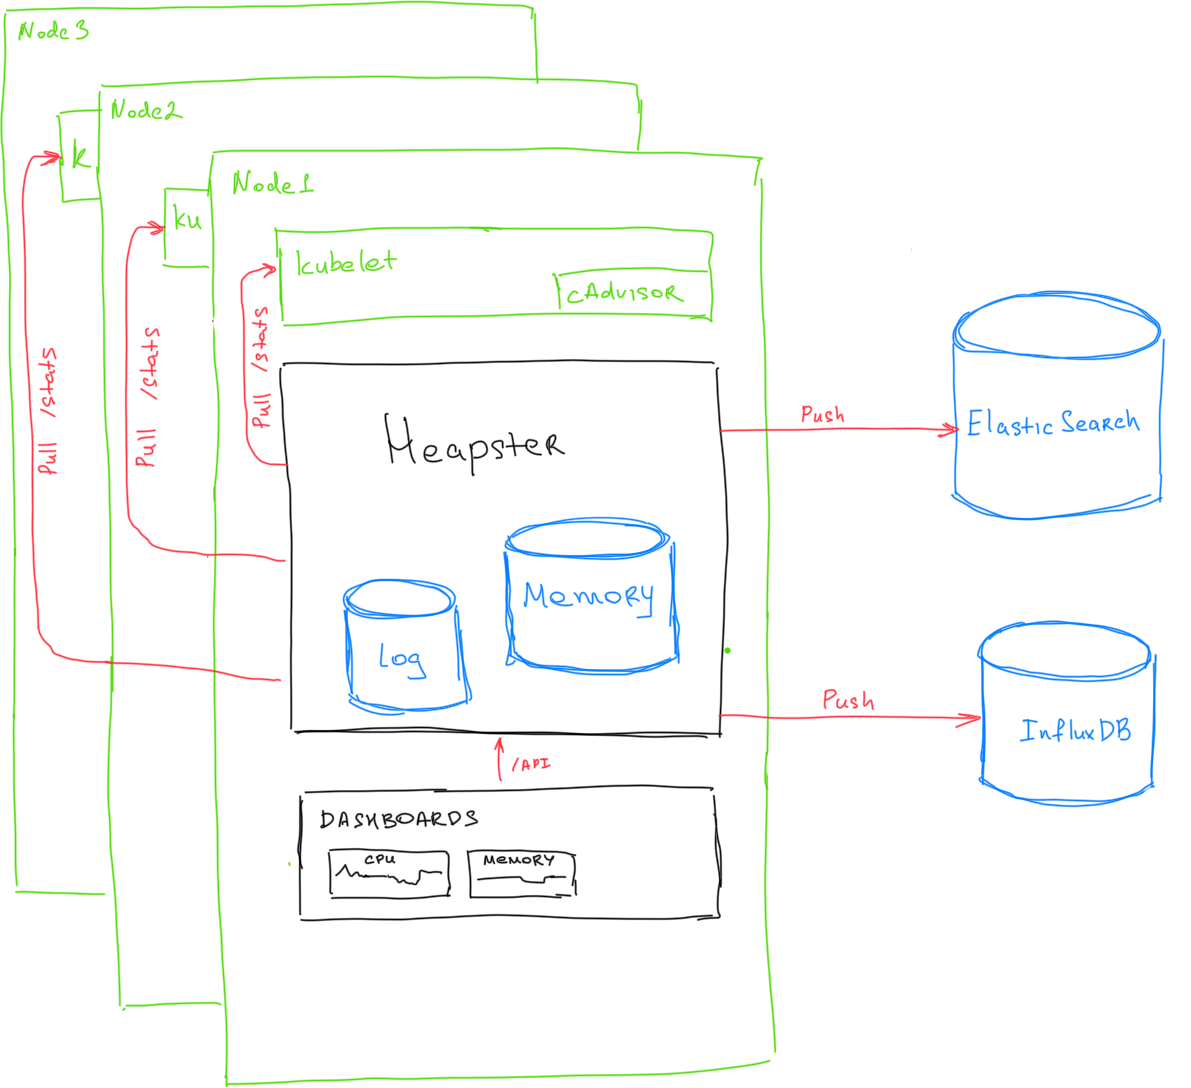
You can find what metrics you can expect from heapster on this link: Metrics.
Considering that Heapster is the project hosted under kubernetes - I would assume that this will be the most stable option with combination of one of the @kubernetes/heapster-maintainers supported sink.
Kubernetes Dashboard
Kubernetes Dashboard is the general-purpose web UI for Kubernetes clusters.
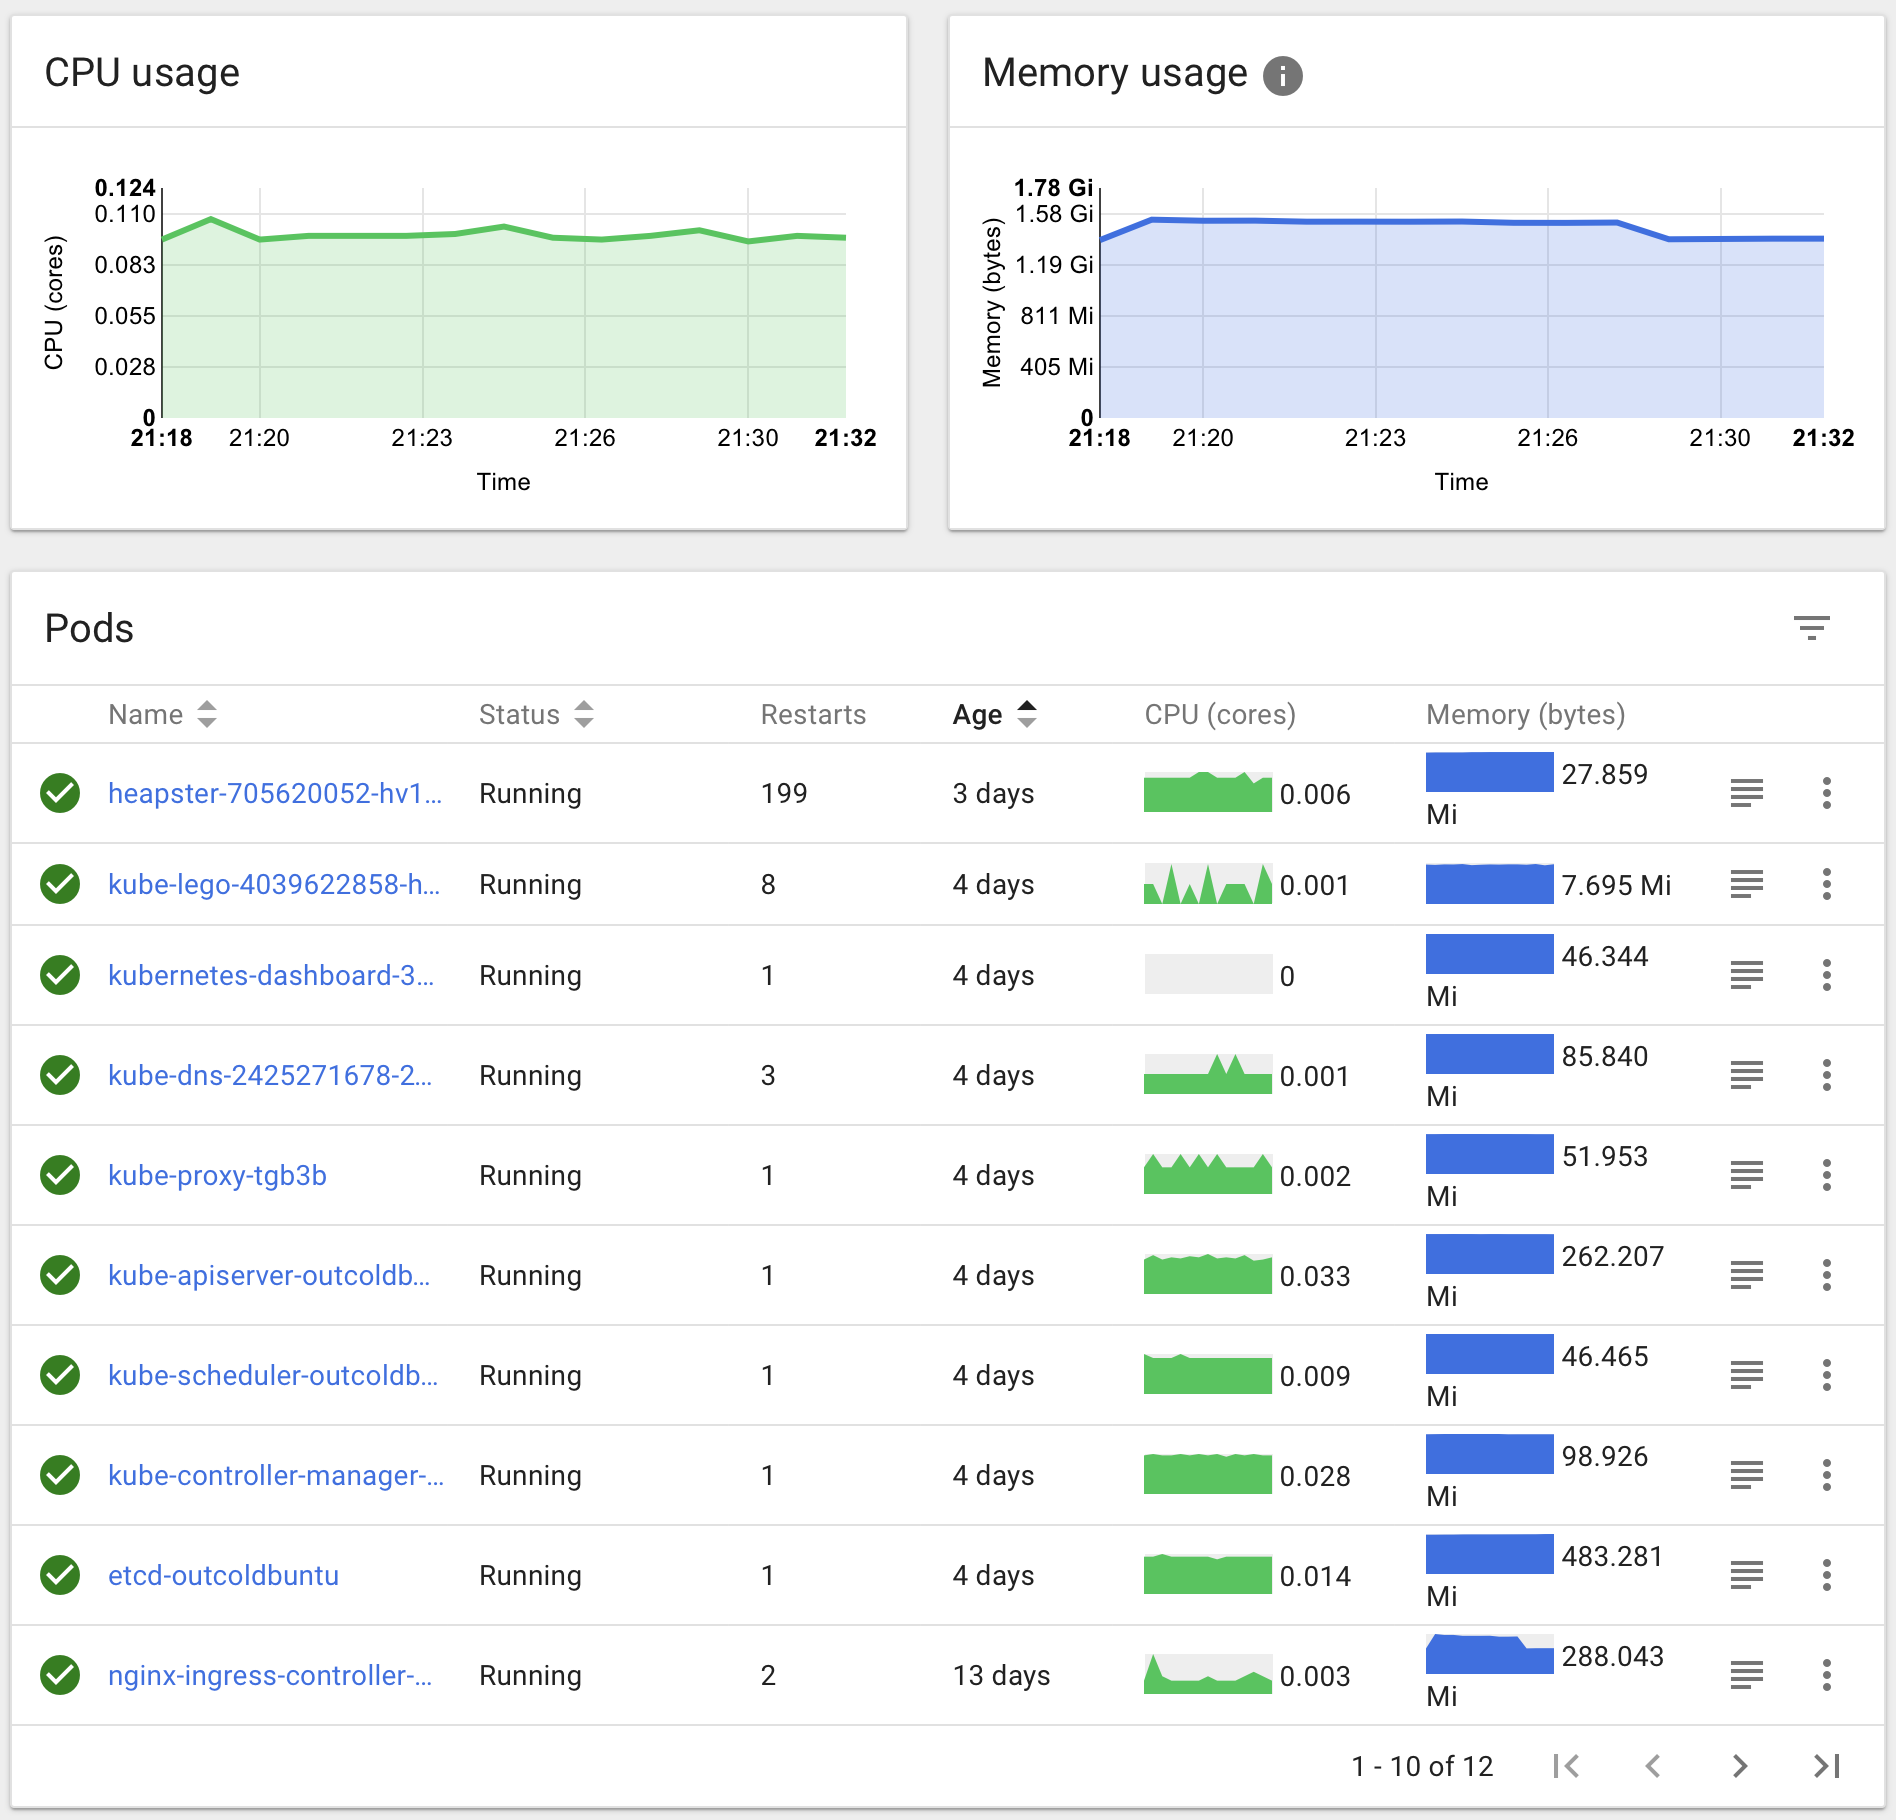
If you will have heapster deployed on your kubernetes cluster then you will be able to see simple resource usage on Dashboard
Prometheus
Prometheus is the open source monitoring system. It is part of Cloud Native Computing Foundation.
Prometheus pulls metrics directly from /metrics endpoint. It does not depend on
heapster. To set it up you need to use kubernetes scrape config.
Because in kubernetes 1.7 /metrics endpoint does not provide metrics reported
by cAdvisor, you need to be sure to use the latest scrape config (currently in PR) see Kubernetes 1.7.0 requires cAdvisor changes. And to make this scrape config to work you need to
enable port 4194 for cAdvisor (see above).
Prometheus gives you a graph ui, which is only useful for debugging. You can also build dashboards with console templates.
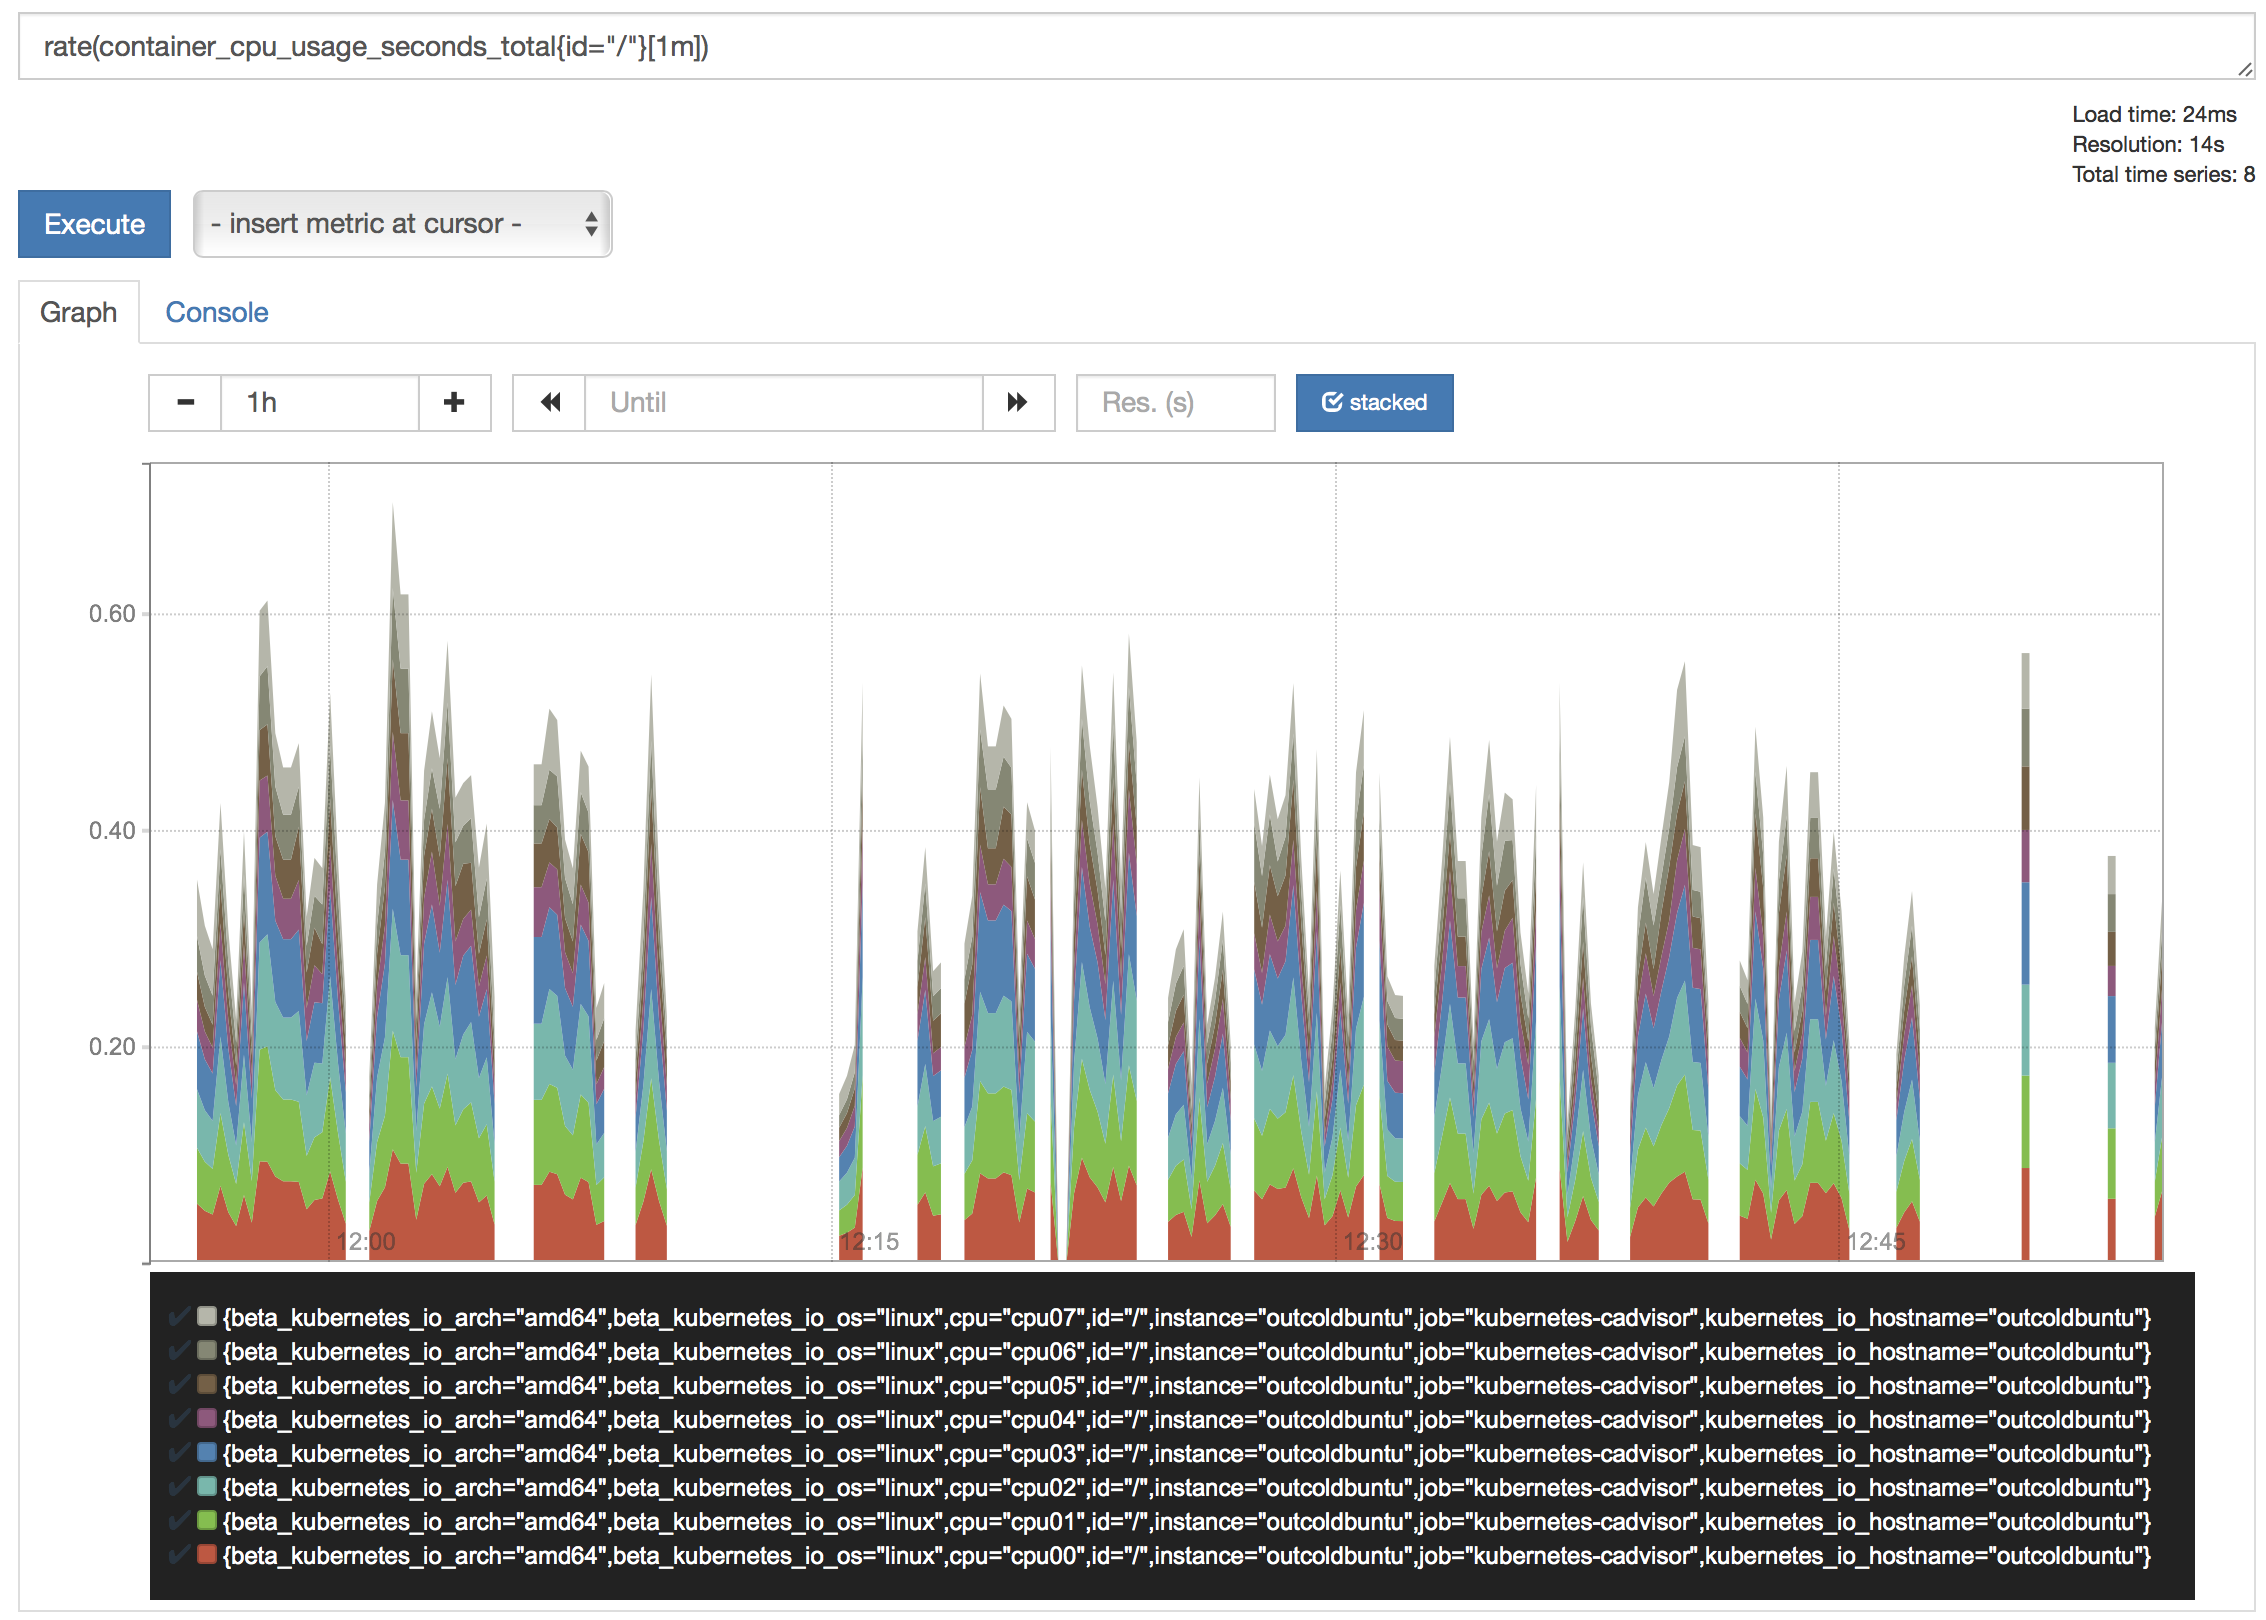
The benefit of using prometheus - you will not only get resource usage, but also internal kubernetes metrics.
Grafana
Grafana is the open source user interface for a time series data.
Grafana allows you to use a lot of various data sources, including prometheus, ElasticSearch and InfluxDB. It is certainly the most advanced open source interface for time series analysis.
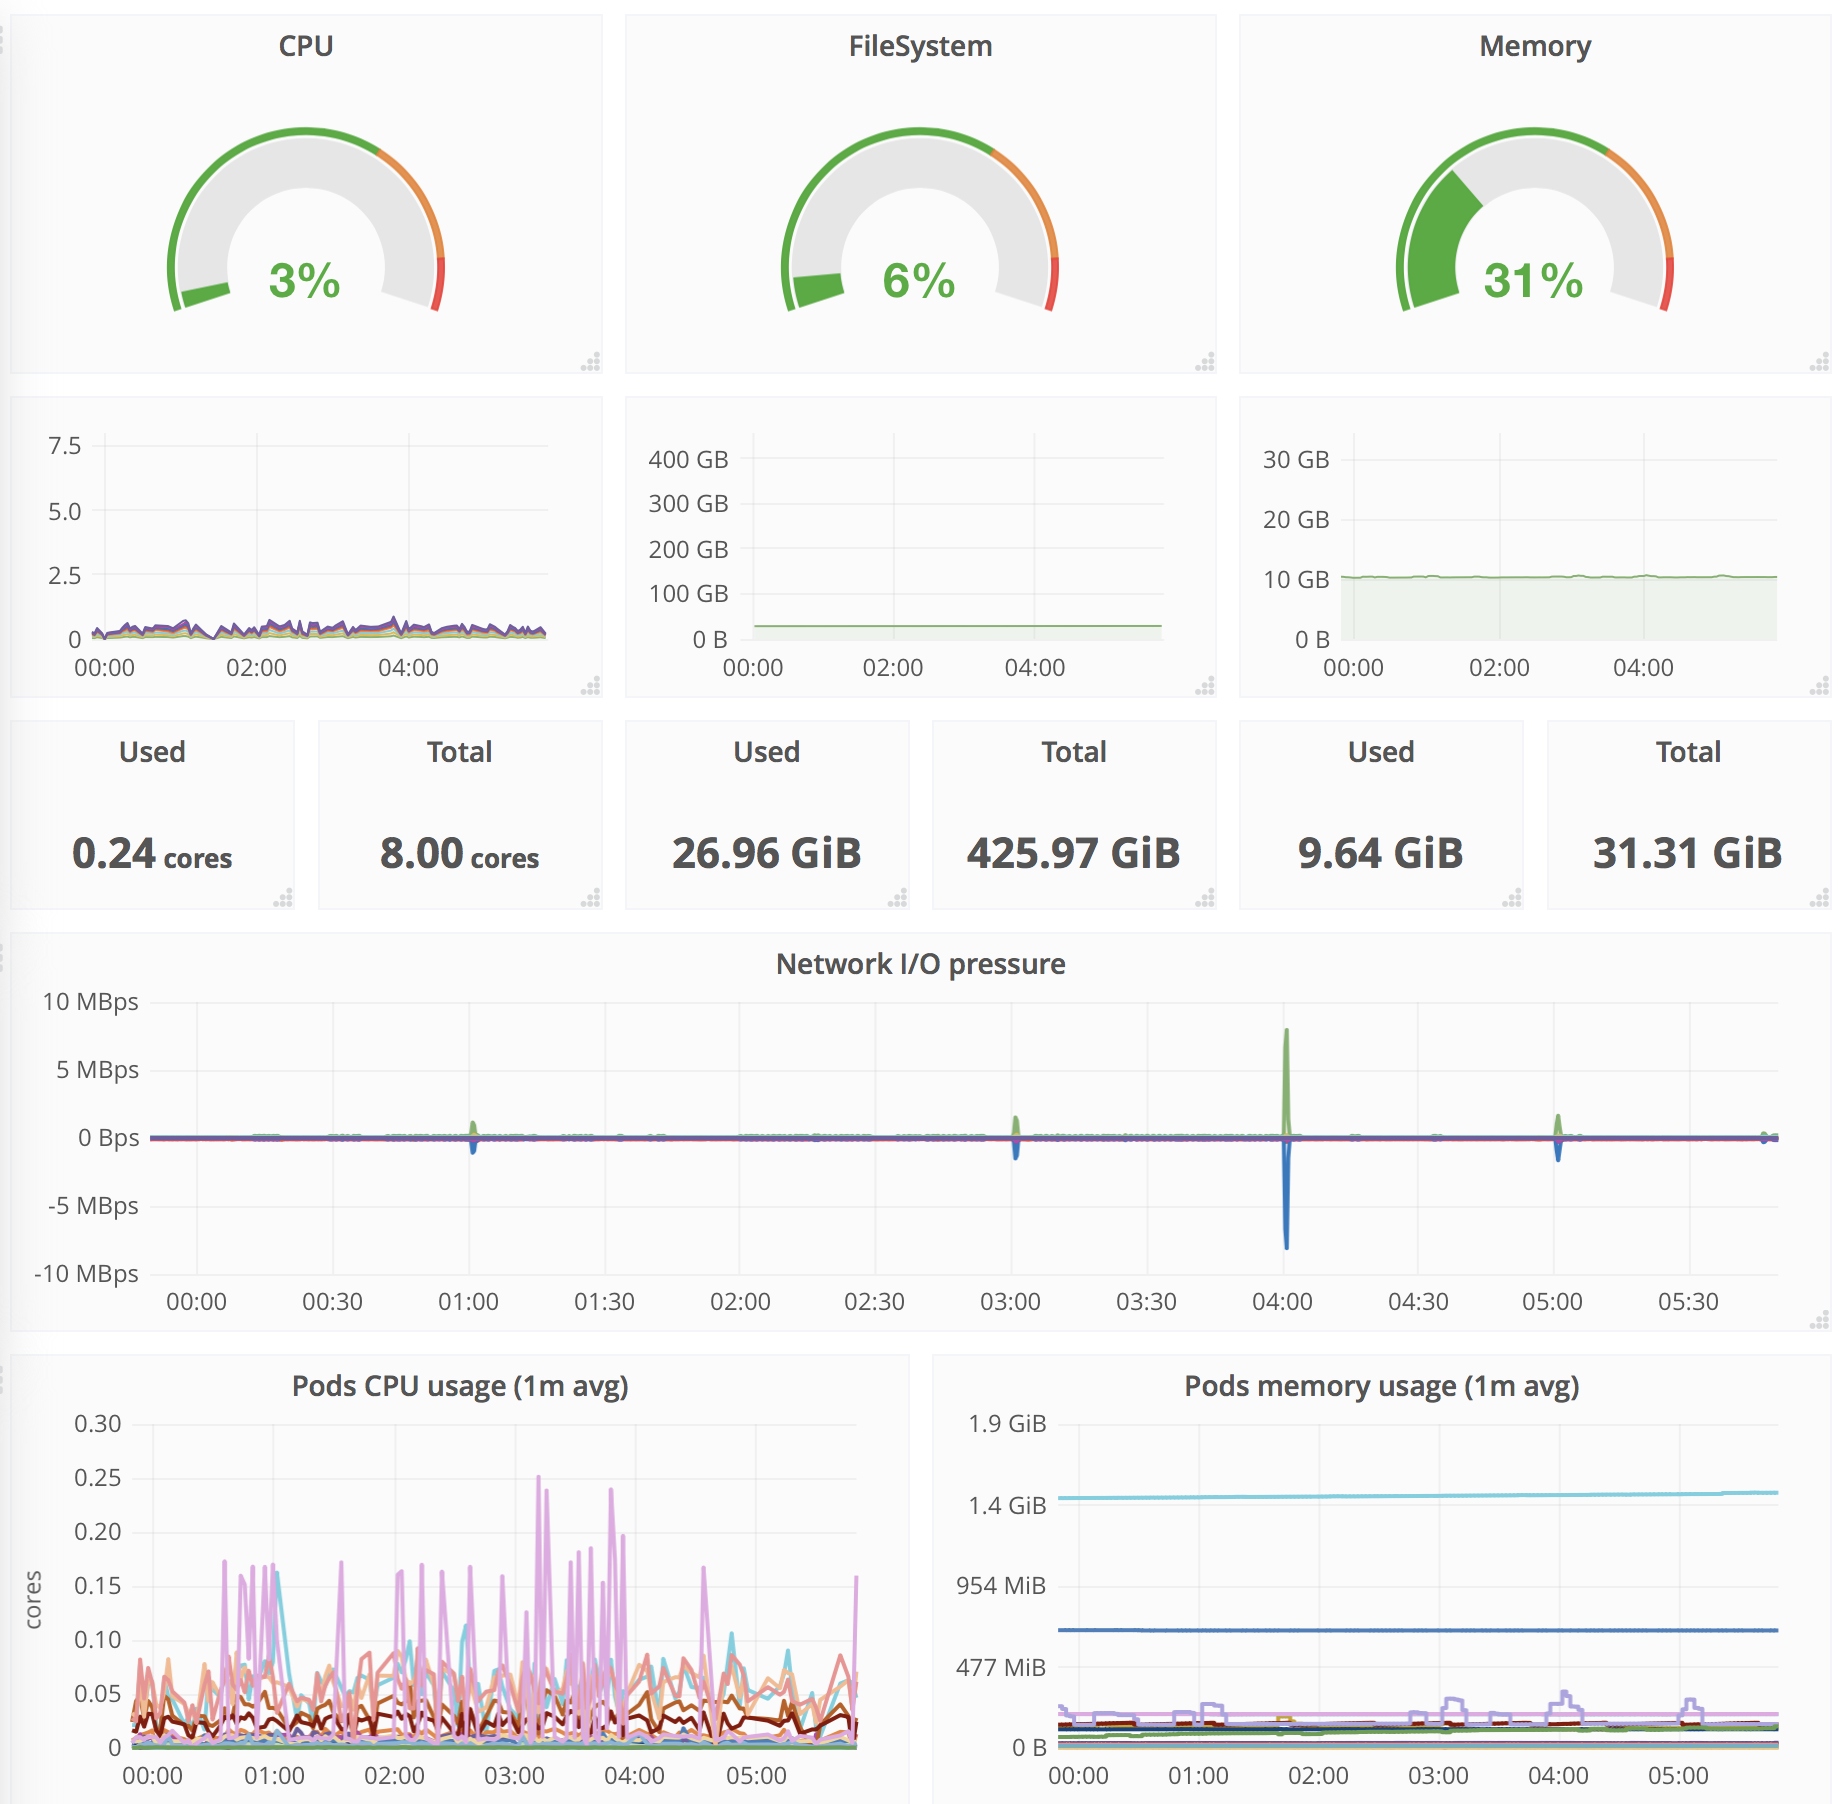
I have built my dashboard on top of Kubernetes cluster monitoring (via Prometheus) by Instrumentisto Team, as a Data Source I have used prometheus.
Elastic Stack
Elasticsearch is a well known database built for full text search. It is getting more and more use cases.
You have several options how you can get metrics in Elasticsearch. First is to use Heapster and set ElasticSearch as a sink. Current implementation of this sink has some issues, meaning it will use more storage and it is a little bit tricky to actually query the metrics, I would not use it in production. But you still can built some dashboards with Kibana.
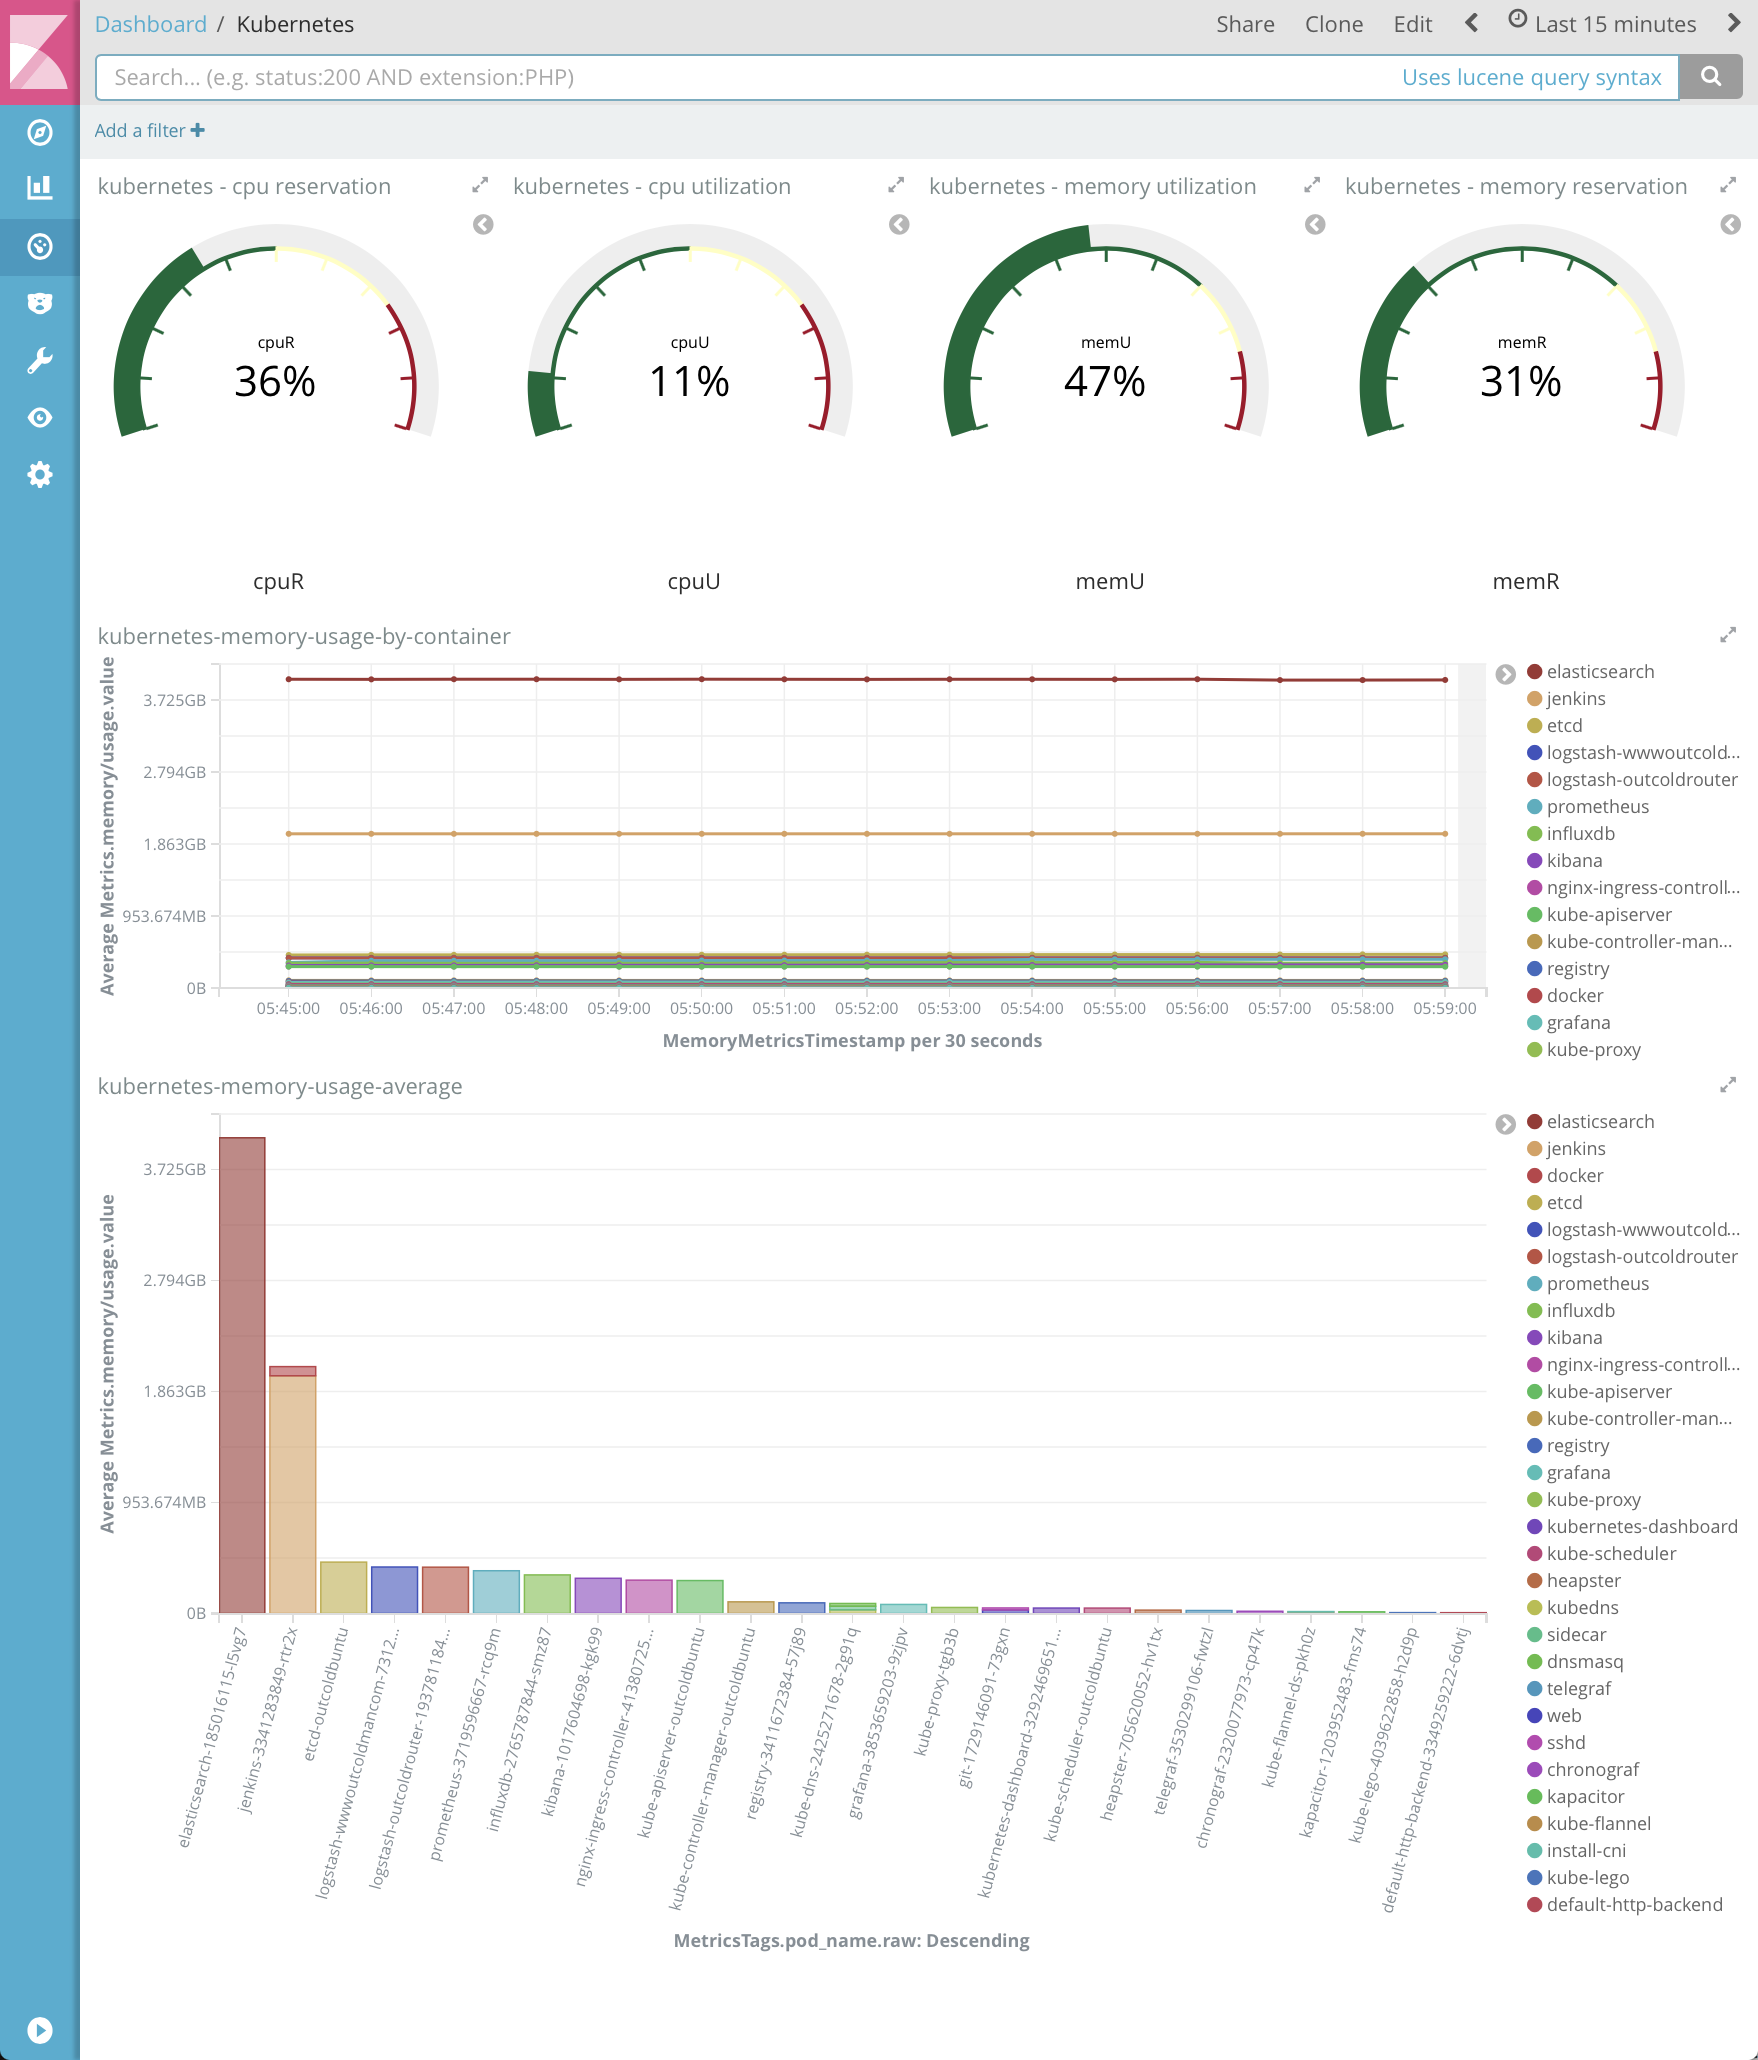
Another option is to use metricbeat with kubernetes module. It is currently in alpha, so I have not tried it yet.
Third option is to use prometheus module and collect metrics directly from kubernetes cluster. That could be tricky, as you probably want to dynamically generate few metrics endpoints specific for nodes.
InfluxData
InfluxDB is the Time Series Database. InfluxDB also has several options how you can get metrics in it.
One option is to use Heapster. Because InfluxDB sink is owner by @kubernetes/heapster-maintainers, I would assume that this will be the most tested, stable and less broken option. So for production and long term support I would probably suggest to use this one.
Another option is to use telegraf with kubernetes input plugin. Telegraf also provides some built in dashboards for Chronograf, when you use specific inputs.
Chronograf is Web Interface provided by InfluxData. Very early stage, dashboards aren’t configurable as much as in Grafana. Data explorer and alerting (need kapacitor) can be useful
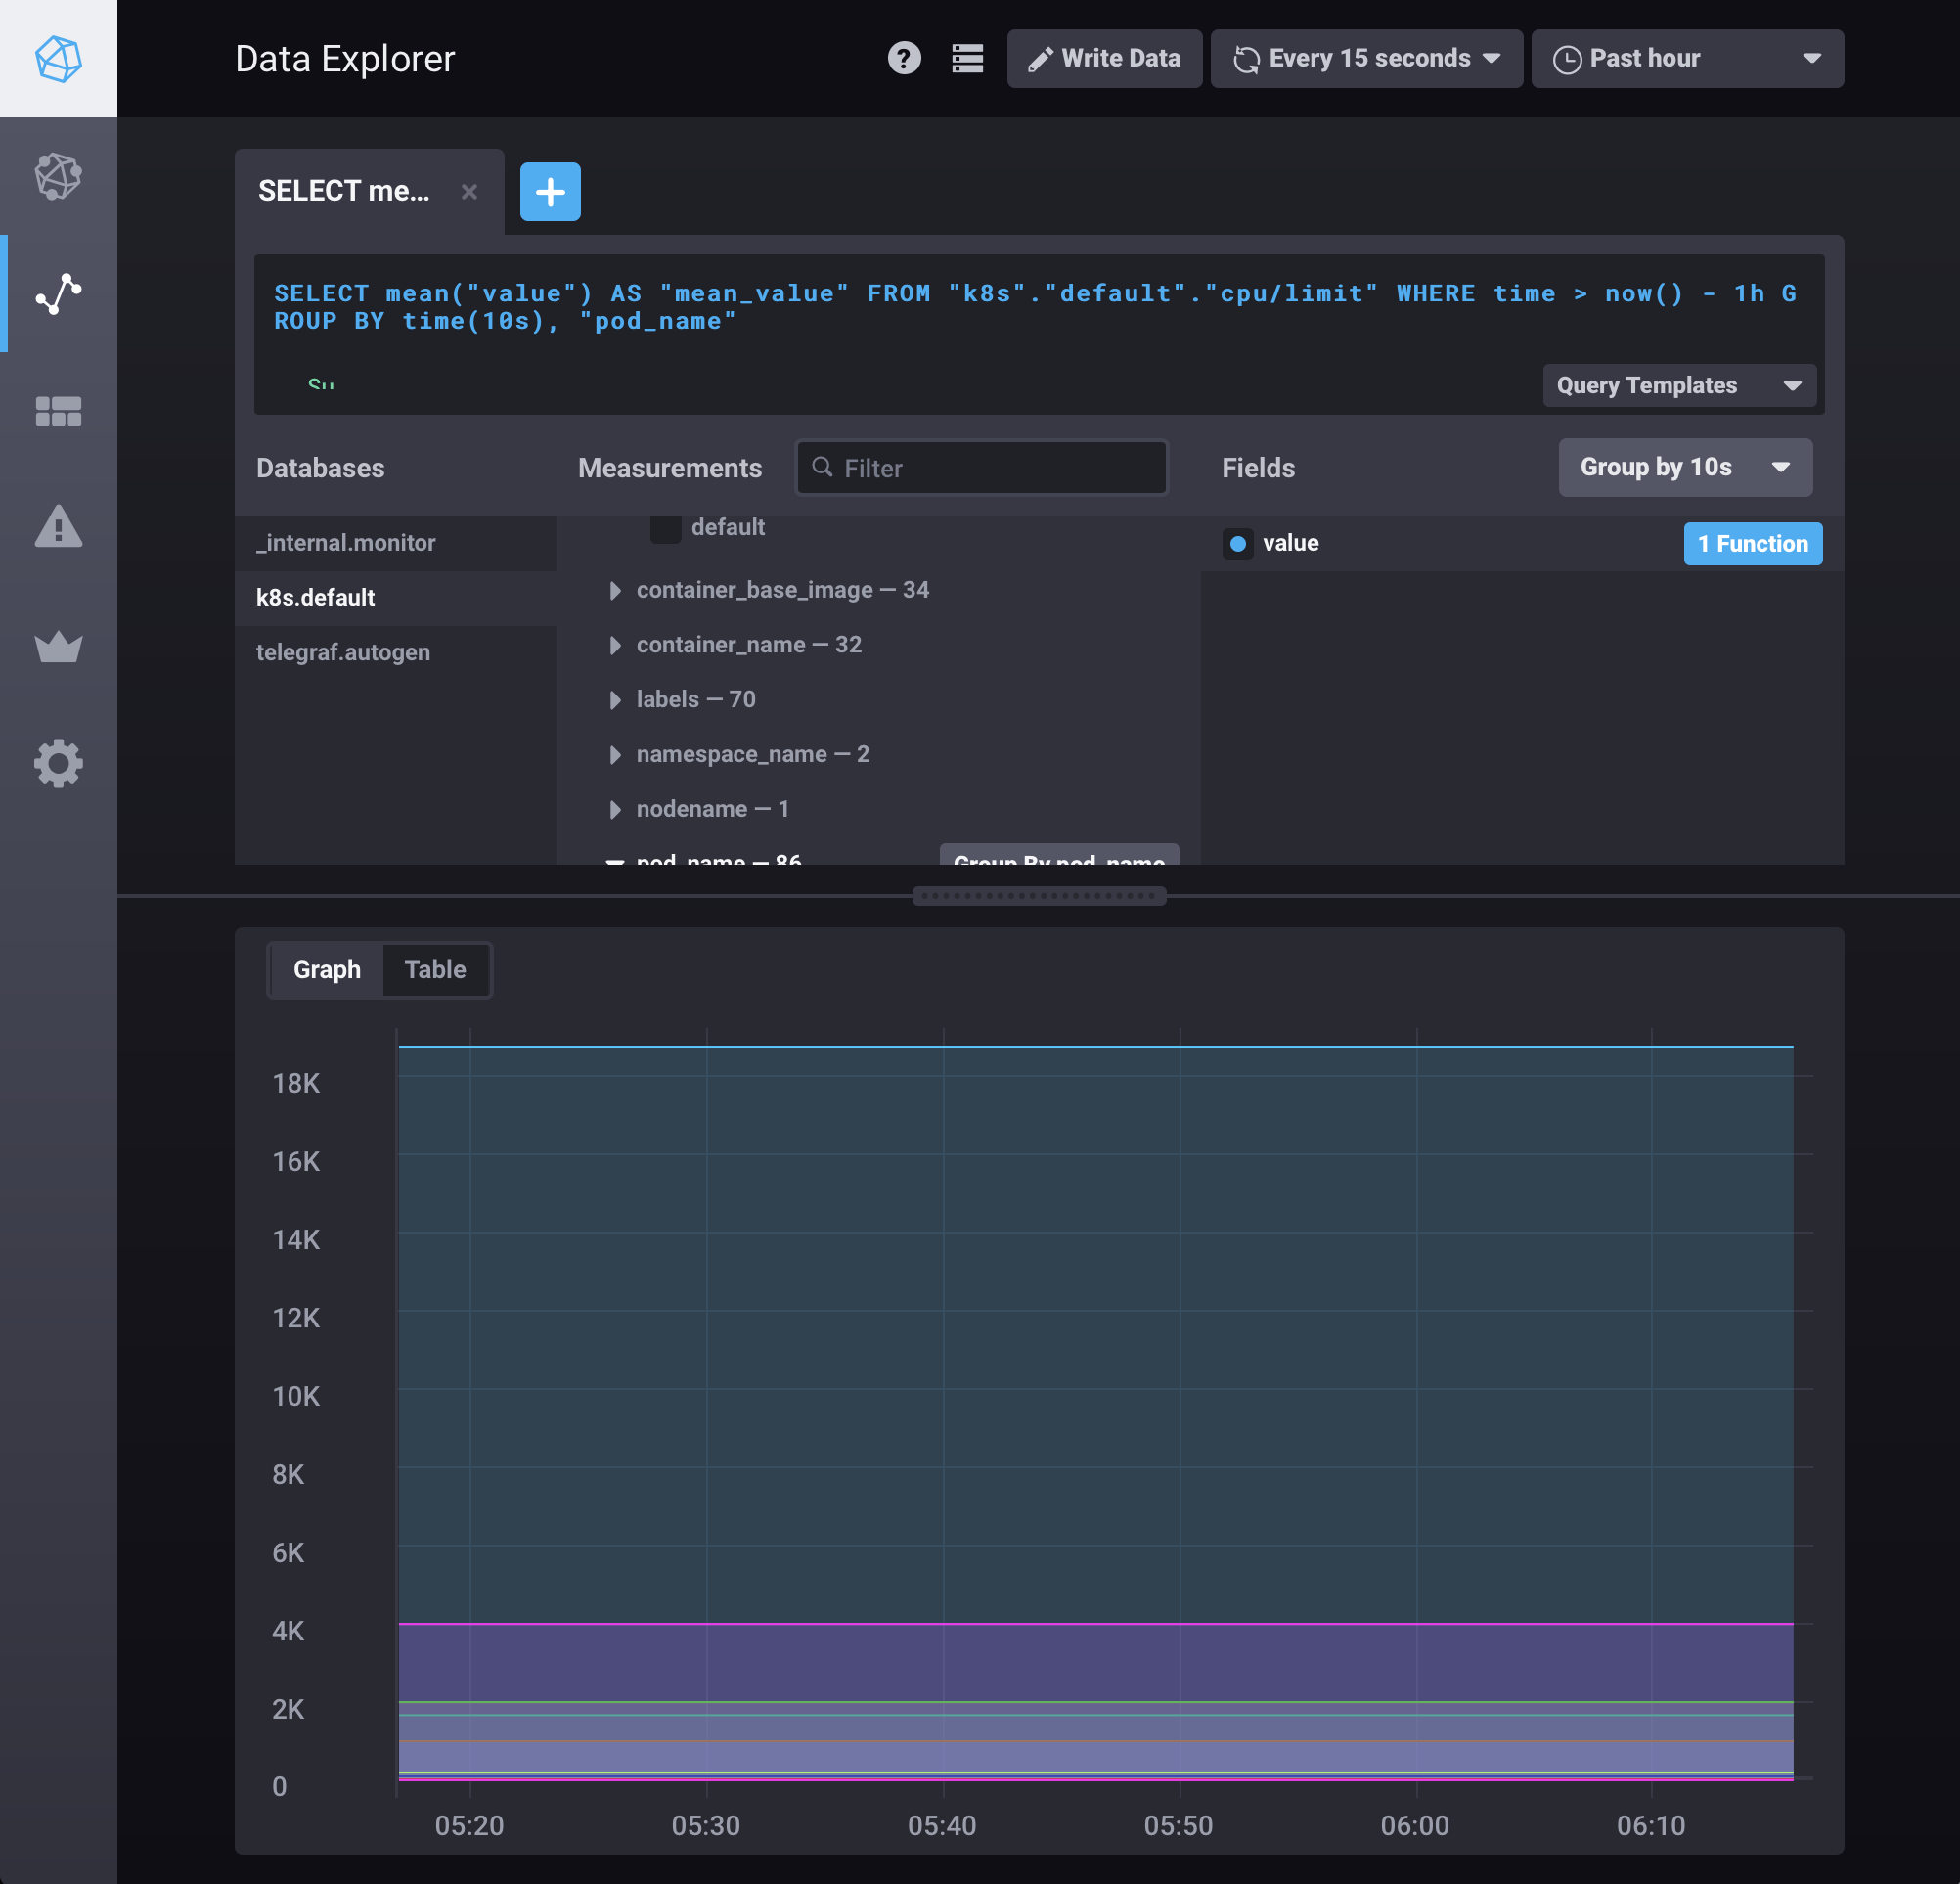
From my opinion chronograf is on very early stage and it feels like that Grafana is the better option.
Summary
As you can see there are a lot of options how you can monitor Kubernets resources. And I am for sure missing a lot of other options, including DataDog. I am still debating on which one to use.
I like prometheus with grafana, because that gives me the most set of metrics. And it feels like that prometheus format is the standard now, so more and more applications provides metrics in that format. So it is good to keep prometheus server around, and looks like with version 2 they will finally get long term storage for metrics.
I also like elasticsearch with kibana, just because I use it for other data as well. Current sink implementation is very hard to manage. I will give a try new kubernetes module in metricbeat at some point, but currently I am not sure if it actually supports elasticsearch/kibana 5.x or I need to have whole stack with version 6.
Heapster with InfluxDB and Grafana is the third choice. That combination feels like most reliable and supported. But because of the prometheus format supported everywhere I would probably stay with prometheus.